Optimizing Retail Supply Chain Management with Salesforce Tableau
Today organizations are harnessing powerful business intelligence (BI) tools and advanced data visualization software solutions to optimize and efficiently handle supply chain operations in the retail sector. Leading and efficient data visualization tools like Tableau provide real-time data visualization, integration, and analysis with enhanced and robust security to improve decision-making and increase efficiency, and scalability.


Retail supply chain management is an end-to-end process that involves overseeing and handling inbound and outbound logistics, resulting in the efficient flow of goods from suppliers to end customers within the retail sector. It ensures that products are available when and where customers need them, minimizing stockouts and overstock situations.
It encompasses comprehensive planning and forecasting demand, sourcing materials, manufacturing, warehousing, inventory management, and coordinating transportation, logistics, and distribution.
Modern SCM is leveraging transformative technologies like ERP systems, inventory management software, RFID technology, IoT, artificial intelligence, and machine learning solutions to track real-time data and gain instant stock visibility.
It also contributes to enhancing operational efficiency and minimizing transportation costs, thereby improving customer satisfaction, and helping the retail sector gain and maintain a competitive edge in the market.
How Retail Supply Chain Ensures Smooth Operations From Sourcing to Final Product Delivery
Supply chain management for retail is a complex process that undergoes several critical steps from demand forecasting and planning to finally delivering the products to the customers. It involves complete coordination among the various departments and full control of the process to ensure a smooth flow of goods from suppliers to customers.
This can be achieved by implementing the core components of supply chain management in retail that are discussed below.
- Demand Forecasting and Planning - Demand forecasting and planning is the first step that enables retailers to meet customer demand and expectations with optimal inventory levels. Retailers analyze historical data, market trends, and consumer behavior to predict future demand using advanced tools and techniques.
- Sourcing - Sourcing involves identifying the right suppliers to deliver the goods at the right time, negotiating the terms and conditions, agreeing on payment models, managing the flow of raw materials, verifying shipments, and sending them to the manufacturing plants.
- Manufacturing - In this phase, the raw materials are manufactured into finished goods. Retailers can have their own manufacturing units or outsource this process to third-party manufacturers.
- Inventory Management - Balancing inventory to meet demand while minimizing holding costs, using techniques like Just-In-Time (JIT) or categorizing the stock items using ABC Analysis.
- Warehousing and Distribution - The finished products are safely stored in warehouses and then the distribution process where they are sent to retail outlets or customers directly.
- Retailing - This is the final step where products are sold to customers through various channels, including physical stores, eCommerce platforms, and mobile applications.
The following article will drive you through an in-depth discussion of Tableau Salesforce and its pivotal role as a data visualization and analytics tool. In addition to that, we will also highlight the core challenges in supply chain management in retail and its impact on operational efficiency.
Our expert Salesforce consultants will further guide you on how to leverage Salesforce Tableau for optimizing supply chain processes, define key metrics for supply chain handling, and outline strategies for data integration.
An Introduction to Tableau
Tableau is a leading and top-notch data visualization and analytics tool that empowers businesses to transform raw data into actionable insights. It is also a business intelligence solution known for its intuitive interface and powerful capabilities, that help organizations make data-driven decisions by providing a comprehensive suite of features designed to handle large datasets, generate interactive visualizations, and foster collaborative analytics.
As a leading Salesforce partner, TRooTech can comprehensively assist your retail business in utilizing Tableau’s full potential to connect with extensive data sources, including cloud services, databases, and spreadsheets to optimize supply chain operations.
Hire Salesforce developers from us to gain this flexibility and integrate and analyze data accurately from multiple sources to make informed decisions.
Tableau also offers drag-and-drop functionality, enabling you to create dashboards, charts, and reports, and simplify complex visualizations quickly and efficiently.
Salesforce Tableau Role as a Data Visualization and Analytics Tool
We have witnessed that Tableau has excelled as an advanced and popular data visualization software to provide a broad spectrum of chart types and customization options. It can design interactive and user-intuitive dashboards, letting users access data dynamically, uncover trends, and make informed decisions.
If we explore it as an analytics platform, we discover that it helps businesses make informed decisions by transforming raw data into actionable insights through intuitive visualizations. It can interpret large datasets to find patterns, analyze market trends, and correlations, including demand forecasting to provide in-depth insights into business performance and future opportunities.
To enable businesses to drive better decisions, Tableau’s data analytics solution uses advanced tools and technologies like data visualization software that transforms data into digestible visuals, and cloud computing to store data and servers securely. It is also using artificial intelligence and machine learning solutions to reason, learn, and adapt data quickly and efficiently.
Additionally, Tableau's mobile app extends these capabilities to smartphones and tablets, ensuring that users can access critical data on the go.
Unlock Your Supply Chain Management Potential in Retail With Tableau + Salesforce
Leverage Analytics Tool to Transform Supply Chain
The Core Challenges Faced By the Retail Industry in Managing Supply Chains
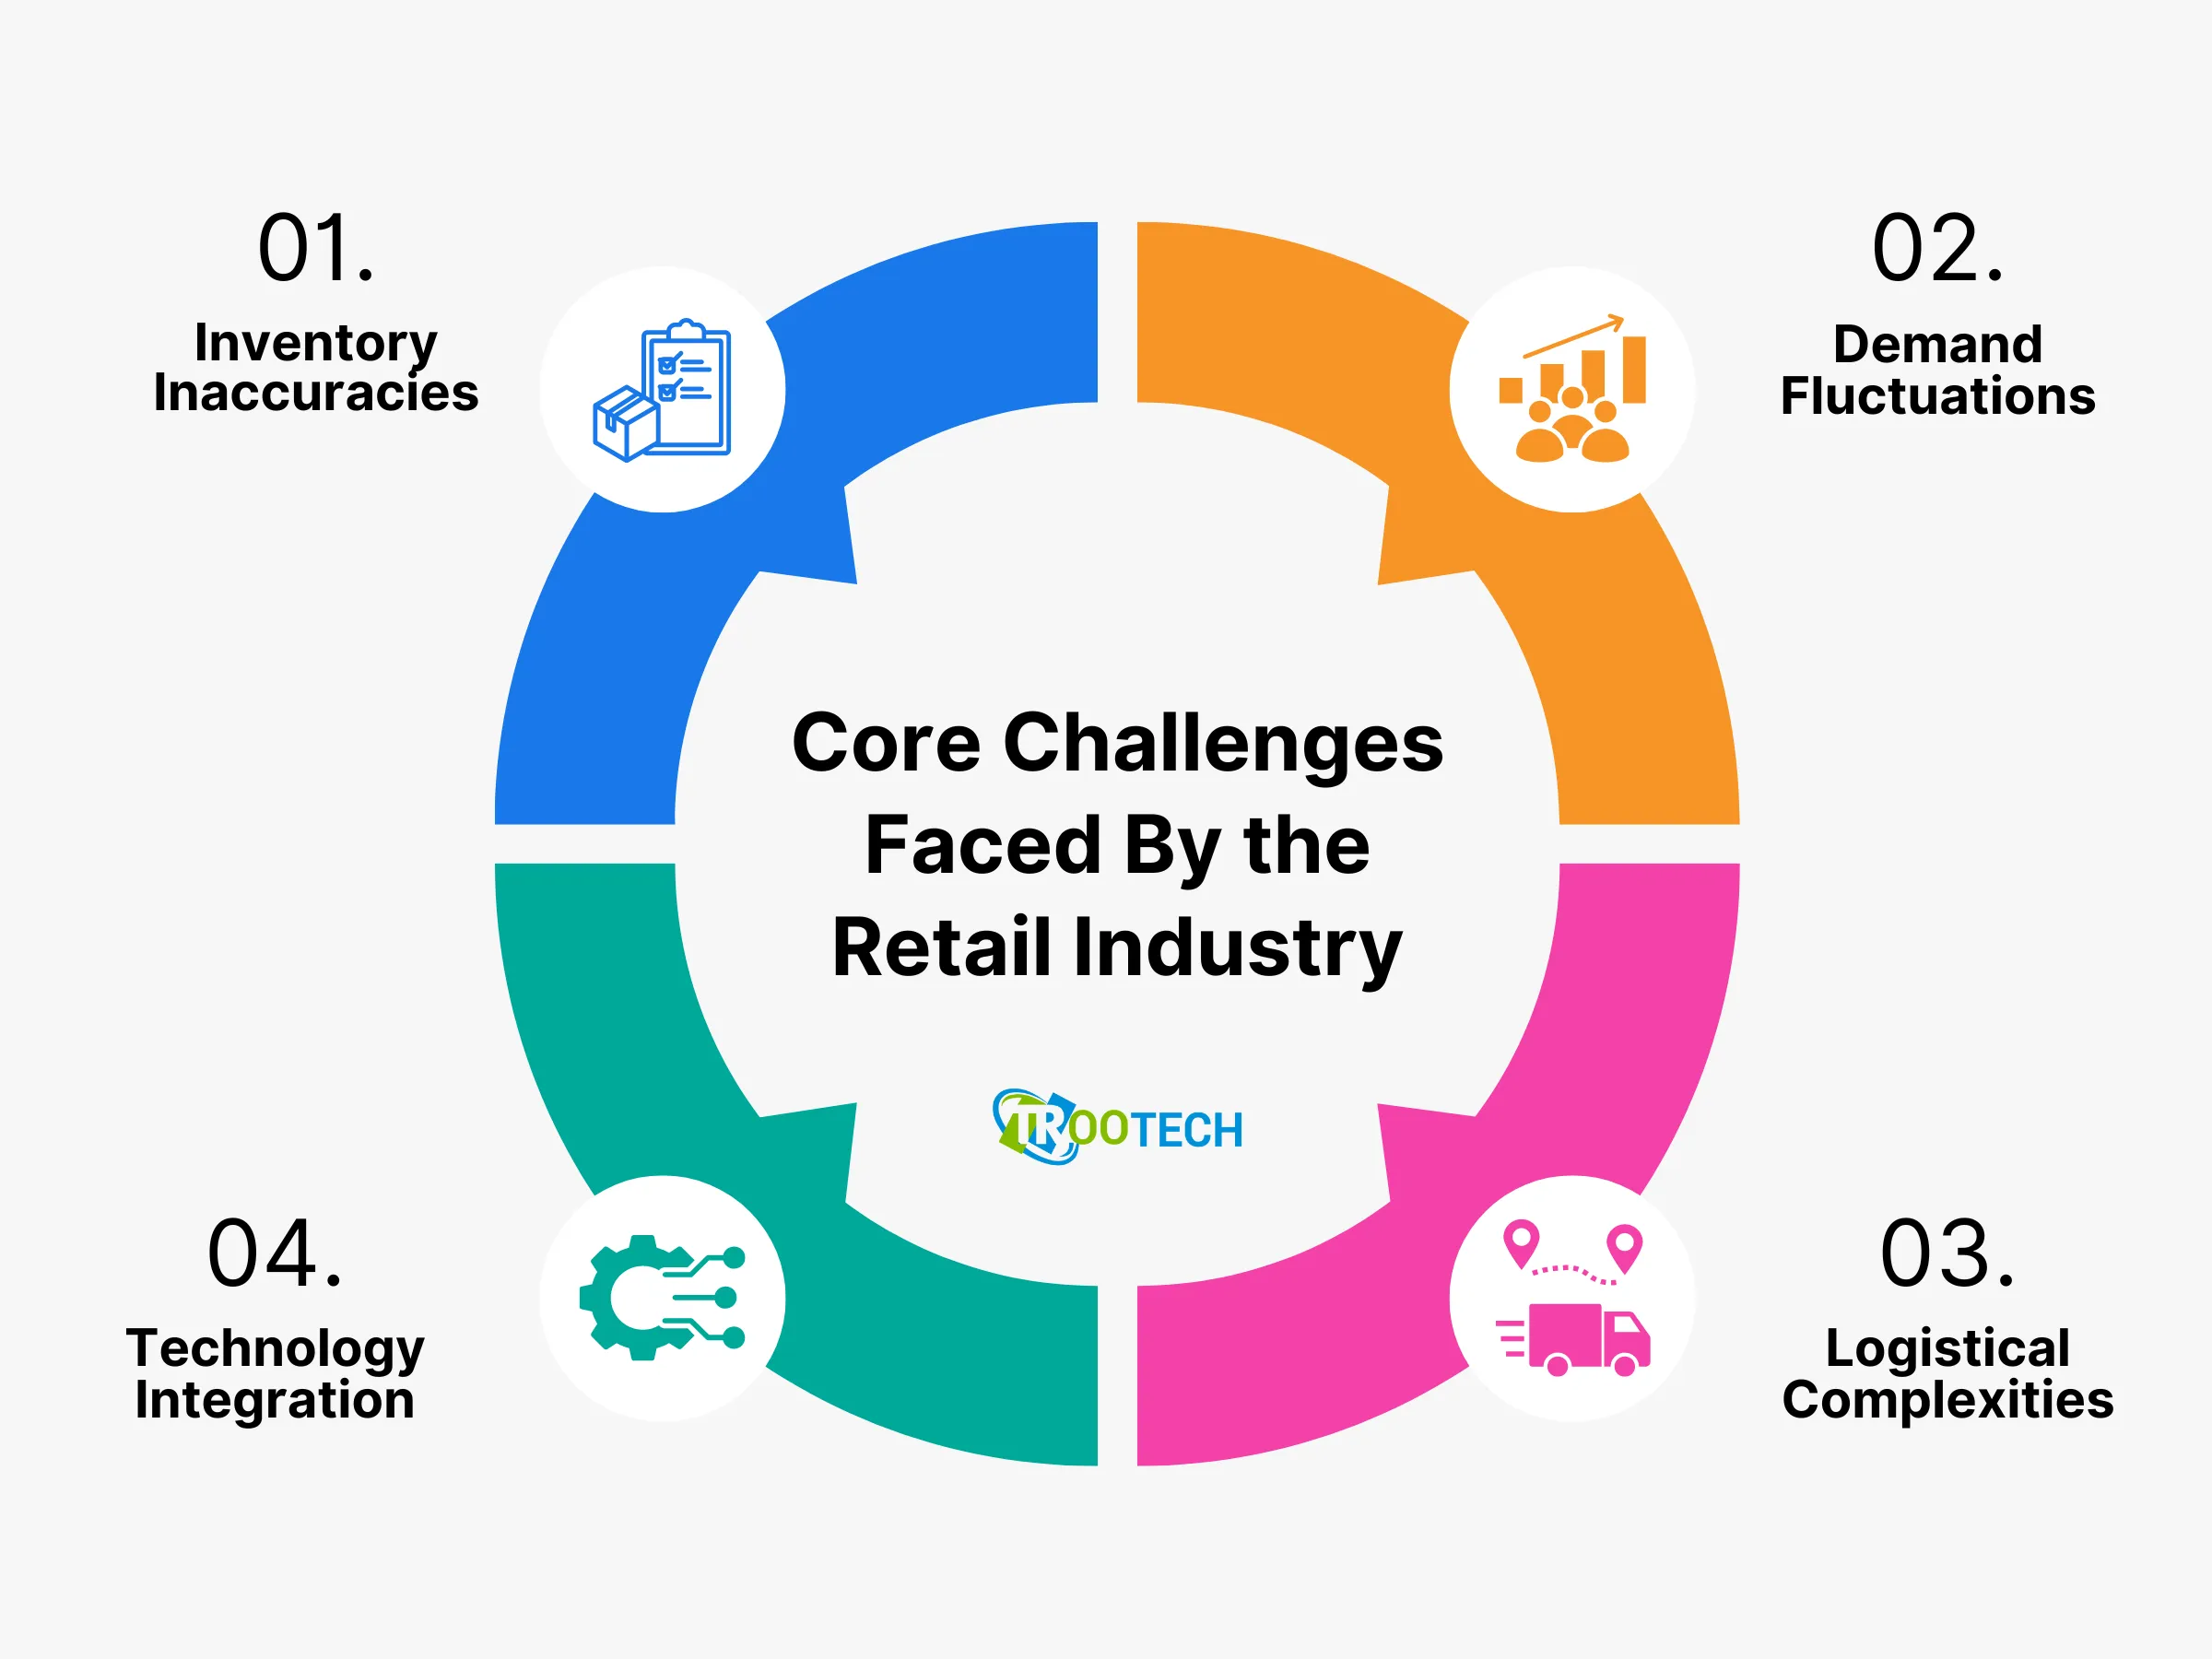
The retail industry encounters diverse challenges while managing the supply chain, which can significantly impact overall business operations and performance, including customer satisfaction levels. These challenges can arise from various discrepancies and mismanagement, such as inventory inaccuracies, demand fluctuations, and logistical complexities.
As Tesla and SpaceX CEO Elon Musk points out, “The supply chain stuff is really tricky.”
We can highlight the main bottlenecks of retail supply chain management below.
- Inventory Inaccuracies - Inventory management is critical in retail, yet inaccuracies can lead to overstocking or stockouts. Overstocking ties up capital and increases storage costs, while stockouts can result in missed sales and dissatisfied customers.
- Demand Fluctuations - Retailers often struggle with unpredictable demand, influenced by factors like seasonality, trends, and economic conditions. Accurate demand forecasting is challenging, and any miscalculations can lead to supply chain disruptions.
- Logistical Complexities - Global retailers dealing with multiple suppliers and regulatory environments counter logistical complexities as the process involves several phases, such as managing transportation costs, delivery times, and route planning., which can pose difficulties, leading to shipment delays.
- Supplier Reliability - Dependence on multiple suppliers can lead to inconsistencies in product quality and delivery times. If a key supplier fails to deliver on time, it can create bottlenecks that affect the entire supply chain.
- Technology Integration - Integrating advanced technologies into the supply chain, such as IoT and AI, can be challenging but essential for real-time tracking and automation.
- Risk Management - Retailers also have to deal with risk vulnerabilities like natural disasters, geopolitical tensions, and economic fluctuations, which significantly disrupt the entire supply chain operations.
- Reverse Logistics - The rise in retail eCommerce has increased the volume of returns, requiring retailers to handle returned goods, restock, refurbish items, and manage refunds, increasing costs and customer dissatisfaction.
Addressing all these supply chain management issues in the retail sector requires a holistic approach, implementing innovative retail management software development solutions, innovative technologies, strategic partnerships, and continuous process improvements to create a resilient and efficient supply chain.
What if we say that Tableau Salesforce is the best solution to cater to all these challenges and core issues efficiently and effectively?
Let Us See How.
Leveraging Tableau to Optimize Supply Chain Operations
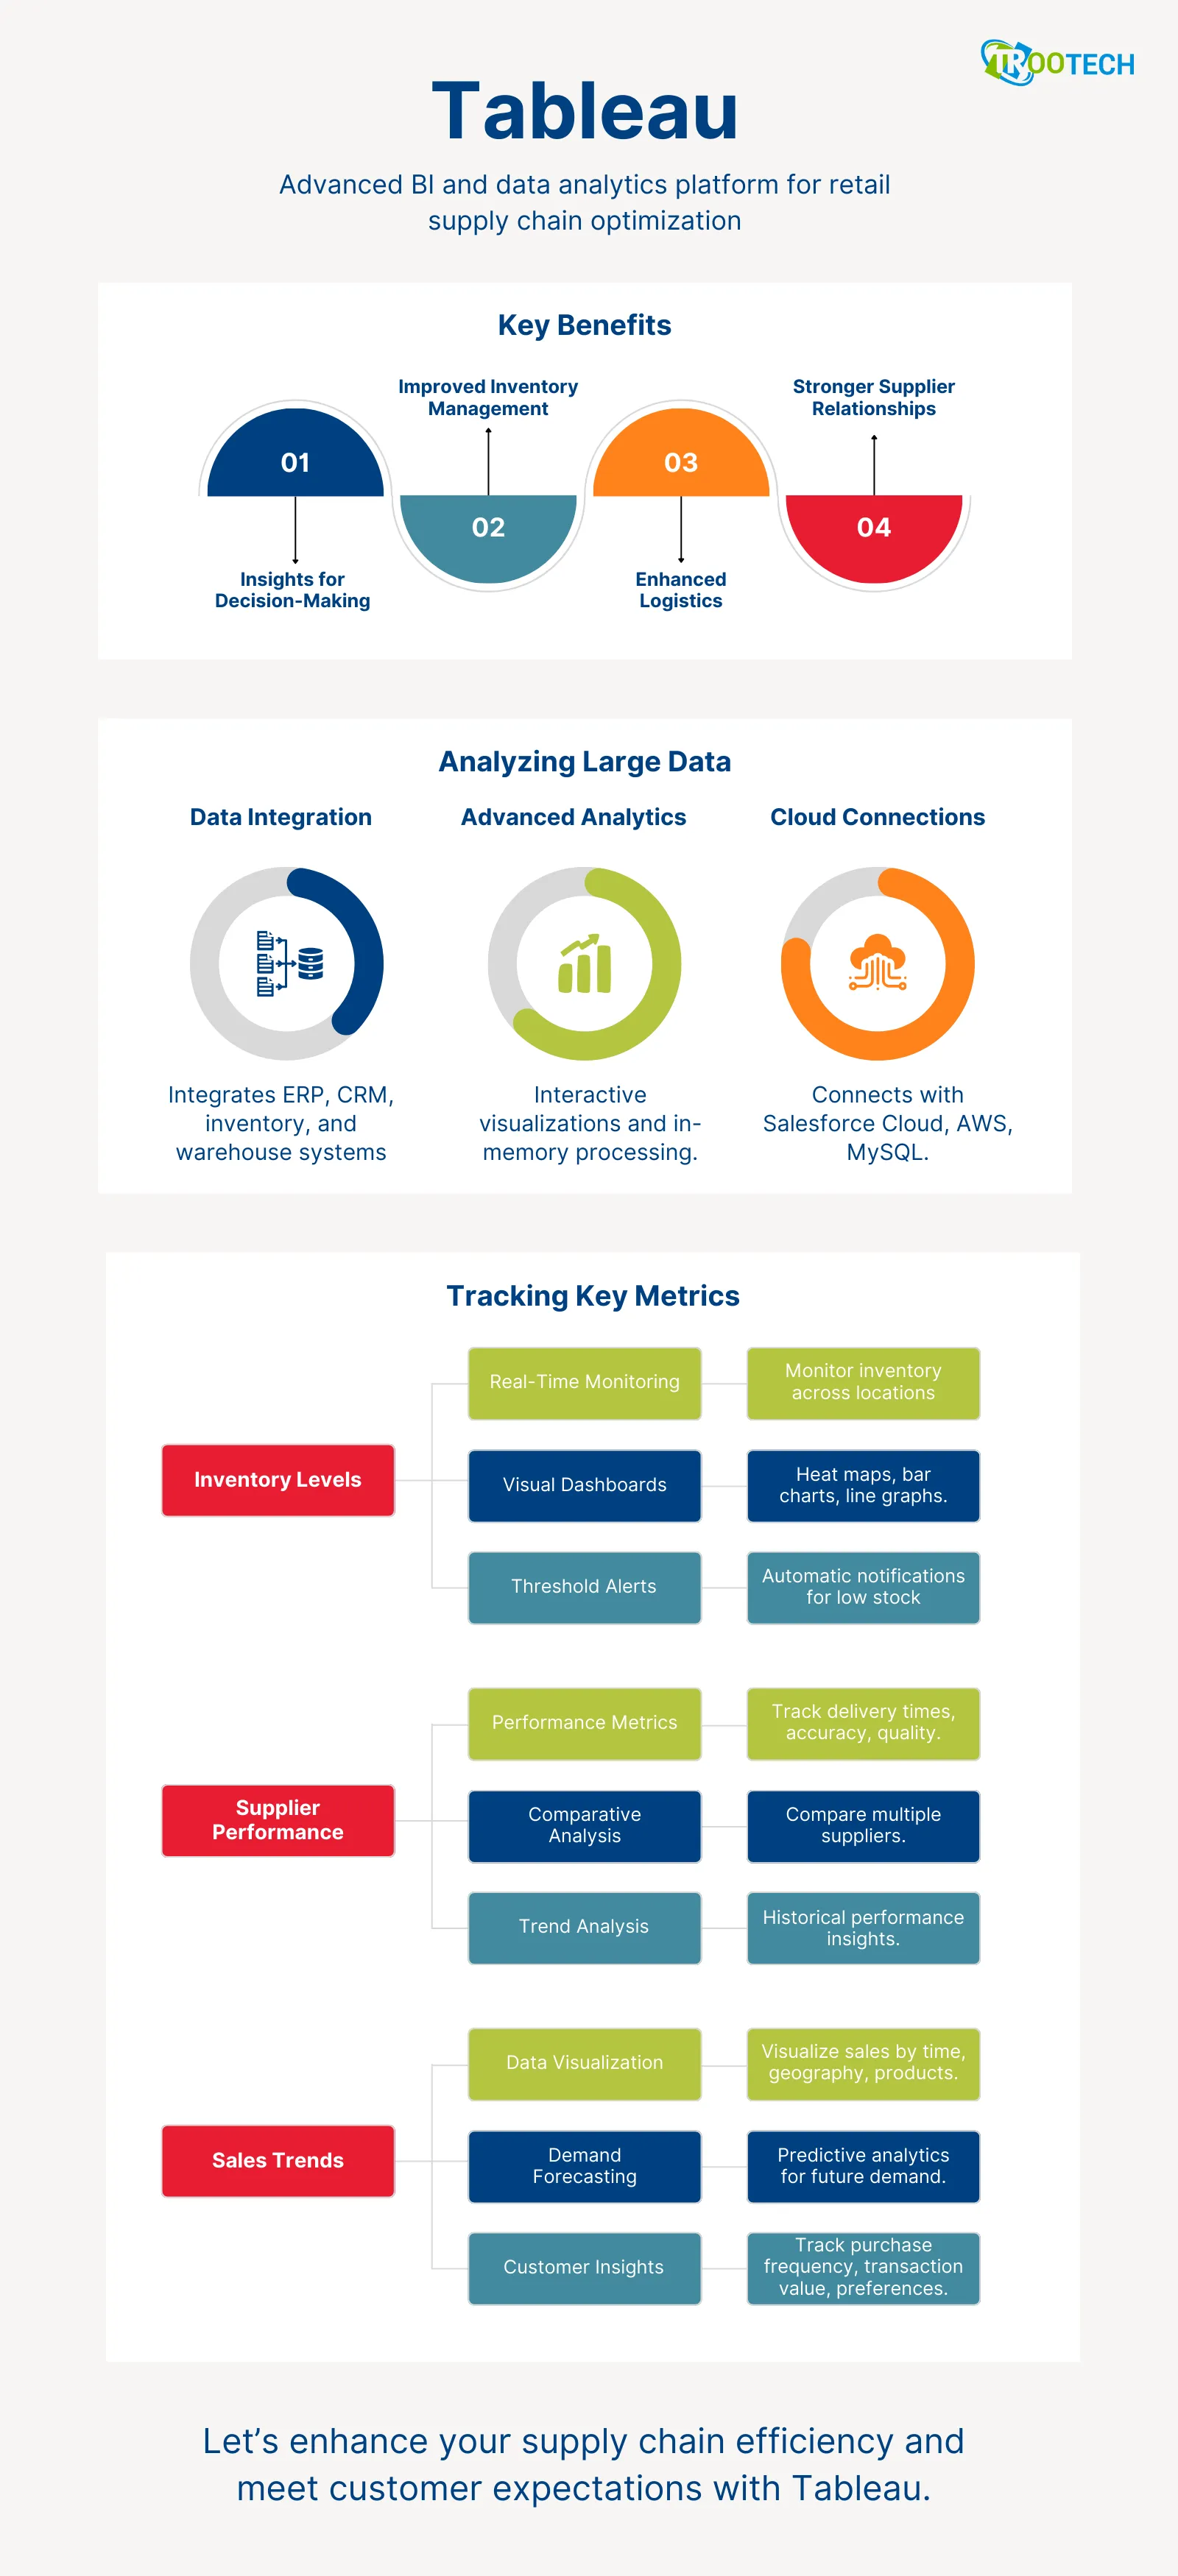
Tableau is a next-generation potent business intelligence and data analytics platform that helps retailers address supply chain challenges and disruptions by enabling them to analyze large data volumes instantly. Retail businesses can gain valuable insights into supply chain processes, enhance efficiency, and meet growing customer expectations.
The tool provides actionable insights that drive strategic decision-making, helping to optimize inventory management, improve logistics, and strengthen supplier relationships.
Analyze Large Data:
Tableau uses advanced tools and methodologies to analyze large volumes of data accurately. These include
- Integration of Multiple Software Systems: Tableau can easily and quickly manage large volumes of data from multiple sources. Retailers can integrate data from multiple systems like ERP, CRM, inventory management systems, and warehouse management tools to identify patterns, trends, and anomalies that impact supply chain performance.
- Using Advanced Analytics and Visualizations: Apart from powerful data integration, Tableau also uses in-memory processing, advanced analytics, and interactive visualizations to large large datasets. It converts the datasets into meaningful insights, driving improved decision-making and effective supply chain strategic planning.
- Connecting With Cloud Services and Databases: Tableau also connects with on-premise and cloud-based platforms and servers to gather and analyze data. It includes cloud services like Salesforce Cloud or AWS and databases like MySQL to ensure seamless integration and pull large
Tableau’s Role in Tracking Key Metrics:
Tableau is an invaluable tool for tracking essential supply chain metrics, such as inventory levels, supplier performance, and sales trends. By providing real-time data visualization and advanced analytics capabilities, it enables retailers to monitor and optimize these key aspects of their operations effectively.
Real-Time Monitoring of Inventory Levels
- Real-Time Monitoring: Salesforce and Tableau allow retailers to monitor inventory levels in real time across multiple locations. By connecting to various data sources like ERP tools, warehouse management software, and point-of-sale systems, Tableau provides a comprehensive view of inventory status.
- Visual Dashboards: Interactive dashboards display current inventory levels, helping retailers identify potential issues such as overstocking or stockouts. Visual elements like heat maps, bar charts, and line graphs make it easy to spot trends and anomalies at a glance.
- Threshold Alerts: Retailers can set up threshold alerts within this data analytics tool. For example, if the inventory level of a critical product falls below a certain threshold, Tableau can automatically send notifications to relevant suppliers, enabling prompt action to replenish stock.
Evaluating the Supplier Performance
- Performance Metrics: With Tableau at Salesforce, retailers can track and evaluate various supplier performance metrics such as delivery times, order accuracy, and product quality. The Salesforce tool integrates data from procurement systems and supplier reports, so retailers can gain a clear view of supplier reliability and efficiency.
- Comparative Analysis: Retailers can use Tableau to compare the performance of multiple suppliers. For example, visualizing on-time delivery rates for different suppliers helps in identifying the most reliable partners and negotiating better terms with underperforming ones.
- Trend Analysis: By analyzing historical supplier performance data, retailers can identify long-term trends and make informed decisions about supplier relationships. This helps in developing more strategic supplier management practices.
Identifying the Latest Sales Trends
- Sales Data Visualization: Tableau allows retailers to visualize sales data across different dimensions, such as time, geography, and product categories while interactive charts and graphs help in identifying sales patterns and trends.
- Demand Forecasting: Retailers can identify and analyze past sales trends to improve demand forecasting. Tableau's predictive analytics tools help them anticipate future demand based on historical data and external factors like market trends and seasonal influences.
- Customer Behavior Insights: Tableau Salesforce provides insights into customer behavior by tracking metrics such as purchase frequency, average transaction value, and product preferences. This information helps retailers tailor their marketing and sales strategies to better meet customer needs.
Get Started With Salesforce Tableau to Maximize Efficiency and Reduce Cost
Visualize Data in Real-Time to Convert it Into Actionable Insights
Key Supply Chain Metrics and KPIs to Track Using Salesforce Tableau
Supply chain metrics are the numbers and ratios a retail company monitors to measure the efficiency of product delivery to the customers. The key parameters are how well, quickly, and cost-efficiently the inbound and outbound logistics have been carried out, ensuring a seamless flow of materials from procurement to delivery.
Key performance indicators define how efficiently the supply chain operations are performing. According to Gartner, 57% of companies track too many supply chain metrics. Retailers can focus on measuring three important types of supply chain metrics and metrics using Tableau Salesforce. These are -
- Inventory Turnover Rate
- Order Fulfilment Accuracy
- Supply Chain Cycle Time
Inventory Turnover Rate
The Inventory Turnover Rate is a process that measures how many times the retail company’s inventory is sold and gets replaced over a specific period, typically bi-annually or yearly. Here, the important metrics to measure are the inventory stock’s liquidity and the efficiency of inventory management.
The formula for calculating the inventory turnover rate is the total cost of the goods sold (COGS) divided by the average inventory.
What about the results? Yes, a higher inventory turnover rate signifies that inventory is sold quickly, indicating effective inventory management and high product demand. On the other hand, if it is on the lower side, it indicates obsolescence, overstocking, and a decrease in sales.
On the other hand, KPIs indicate that retailers must create strategies to accelerate slow-moving inventory with discount and sale offers. It also helps to optimize stock levels and reduce costs.
Order Fulfillment Accuracy
Order Fulfillment Accuracy measures the percentage of orders that are correctly picked, packed, and delivered without any errors. This includes ensuring the right products are delivered in the correct quantities to the right customers within the estimated shipping time.
The formula for calculating order fulfillment accuracy is the total number of orders fulfilled correctly divided by the total number of orders and multiplied by 100.
The core significance of order fulfillment accuracy supply chain metrics is that if it is on the higher side, it increases customer satisfaction, retention, and loyalty, while its decline indicates reverse logistics and product returns with customer dissatisfaction.
If we talk about KPIs, it helps in tracking the effectiveness and efficiency of the fulfillment process and identifying specific areas in the fulfillment that need improvement like accuracy in picking the goods and packaging.
Supply Chain Cycle Time
Supply Chain Cycle Time measures the total time taken from the moment a customer places an order until the product is delivered. This includes order processing, manufacturing, warehousing, and shipping time.
The formula for calculating supply chain cycle time is Order Processing Time + Manufacturing Time + Shipping Time. The duration of supply chain cycle time metrics inform retailers of whether the supply chain is efficient and faster delivery or suffering from inefficiencies or loopholes, delaying the delivery process.
KPIs allow retailers to evaluate efficiencies and bottlenecks in the supply chain, and enhance customer satisfaction by speeding up delivery.
Select the Best Cloud Service Provider That Aligns With Project Requirements
Take the Next Step Towards Embracing Cloud Engineering Services
Data Integration and Visualization Strategies
Our Salesforce developers adopt a systematic approach while integrating data from various retail systems, ensuring accuracy, efficiency, and seamless data flow. These experts have outlined comprehensive strategies for smooth data integration from ERP and POS systems into Salesforce Tableau.
- Identifying the Data Source - First, you must identify the main data sources within the retail systems, crucial for supply chain optimization, and know which data aspects are required for integration, such as sales, inventory, or customer information.
- Deriving the Data - Use Tableau Salesforce’s APIs or connectors for extracting data from ERP and PoS systems and ensure compatibility and data integrity to avoid inaccuracies.
- Transforming and Cleansing the Data - The next strategy involves cleansing and transforming the raw data into a standardized format for easy and quick analysis in Salesforce Tableau.
- Loading the Data - The transformed data is loaded into Tableau using connectors or importing functionalities directly. Our developers update data regularly so that users can access real-time visualizations and make accurate analyses.
- Integrating the Data- Integrate data into Tableau from multiple sources to create datasets, providing a complete view of retail operations. Use blending methods to align datasets from the retail system and preserve their integrity and granularity.
- Visualization and Analysis - Create visualizations and dashboards that integrate data from retail systems and implement drill-down and filter options, allowing users to explore data insights instantly.
- Security and Access Control - Salesforce and Tableau allow you to implement robust security measures to protect sensitive data by defining the user roles and permissions to ensure only authorized access.
- Optimizing Performance - Amplify Tableau dashboard performance by optimizing the data integration process and generating quick reports. Address the performance loopholes with speed and accuracy.
- Support and Maintenance - Provide continuous support and ongoing maintenance to resolve queries and ensure seamless integration of retail systems with Tableau.
The Significance of Data Integration For Enhanced Supply Chain Management

- Seamless data integration ensures enhanced supply chain visibility and access to real-time insights on inventory levels, order status, and shipping details.
- Integrating Salesforce Tableau data with retail systems streamlines supply chain operations by automating data entry tasks to reduce errors save time, and improve employee productivity.
- It allows retail companies to forecast demands accurately and maintain the right inventory levels. Data integration for demand forecasting is the combined effort of market trends, historical sales data, and customer feedback.
- Integrated retail systems with Tableau Salesforce pave the way for enhanced supplier collaboration with real-time information on shipping and product quality.
- Data integration also helps retailers comply with logistics and supply chain requirements and regulations, mitigating risks and potential issues related to product deliveries.
- It assists in minimizing transportation and logistics costs by optimizing inventory management and warehousing.
- Data integration results in faster product launches and accelerates market response times to speed up decision-making with instant data access.
Best Practices to Create Clear and Actionable Data Visualization
Experienced data analysts from our leading software development services company help retail companies create and implement clear and actionable supply chain data visualizations using Tableau at Salesforce to facilitate improved data access and decision-making. Here are the best practices to design one.
- Create a Simplified Design- First, you must focus on using uncluttered visuals to enhance readability and prevent information overload with a simplified design process to ensure is visible.
- Highlight the Key Metrics- Salesforce and Tableau allow you to emphasize critical information and use bold colors to highlight the key information. You can also use larger fonts to guide decision-making effectively.
- Effective Color Coding- It is an important data visualization practice that uses contrasting colors to differentiate data points and highlight trends, improving clarity and focus.
- Use Clear Labels and Patterns - Data analysts must ensure labels and patterns used for the visualization are concise and easy to read, helping users quickly understand the data.
- Interactive Data - Use the filter and drill-down options carefully to highlight your main data points with customizable options to view data as required.
- Real-Time Data - Update your data insights regularly to ensure insights are timely and actionable, leading to informed decision-making.
- Avoid Adding Extra Elements - Apart from keeping logistics and supply chain management data visualization simple and user-intuitive, you must avoid adding extra elements that can divert user attention and make data clustered.
- Ensure Data Accuracy - Ensure the data is accurate and reliable to build trust and make informed decisions based on sound information.
- Storytelling - Use data visualizations to tell a clear and compelling story that aligns with business objectives and supports decision-making.
Defining Case Studies and Success Stories
Coca-Cola Bottling Plant Increases Their Sales With Mobile-Powered Dashboard
Tableau Salesforce built a mobile-powered dashboard on iPads in the field for the Coca-Cola Bottling Plant, enabling their sales team to enhance timeliness to sell more products. Also, the tool automatically updates the sales report daily to drive strategic decision-making. Tableau also allows its business intelligence team to efficiently manage all sales reports and optimize delivery operations against the allocated budget. The Tableau Server sets automated refreshes and the higher leadership can view all data in one place instantly.
Mondelēz International Digitizes and Transforms the Procurement Process
Similarly, Mondelēz International used Salesforce Tableau to revolutionize and digitize the procurement process with 160+ data fields, more than 28,000 suppliers, and save millions of dollars. The company has leveraged Tableu’s analytics platform to increase operational efficiency, drive more revenue growth, and enhance cost savings. Tableau also helped the largest biscuit and candy manufacturing company improve supplier and stakeholder collaboration, examine KPIs accurately, and accelerate delivery times.
Useful Tips and Practices to Implement Salesforce Tableau For Supply Chain Management

If you are looking to implement Salesforce Tableau for managing your supply chain chain, you must follow these important tips.
Data Preparation
Data Preparation is a crucial step in implementing Salesforce Tableau for supply chain management. Here, retailers must identify key data sources spanning ERP systems, inventory databases, and logistics platforms. Ensuring data quality through cleansing and normalization is paramount, addressing issues like duplicates and inconsistencies.
Establishing robust data governance practices helps maintain accuracy over time. Concurrently, defining metrics and KPIs aligned with supply chain objectives—such as inventory turnover rates and on-time delivery performance—ensures that the insights gained are relevant and actionable for decision-making.
User Training
User training is equally essential to maximize Tableau's effectiveness across the organization. Retailers should develop tailored training programs for various roles, emphasizing hands-on practice in creating and interpreting supply chain analytics.
By showcasing real-world scenarios and encouraging collaboration, retailers foster a culture of data-driven decision-making. This approach not only enhances user proficiency but also promotes knowledge sharing and continuous improvement in leveraging Tableau's capabilities.
Establish Clear Goals and Milestones
Establishing clear goals and milestones is critical for a successful Tableau implementation in supply chain management. Retailers should define specific objectives, such as improving inventory visibility or optimizing procurement processes, ensuring they are SMART (Specific, Measurable, Achievable, Relevant, and Time-bound).
By breaking down objectives into measurable milestones and tracking progress through Tableau dashboards, stakeholders can monitor KPIs in real time. Regular evaluations and adjustments based on user feedback ensure that Tableau continues to align with evolving business needs, driving continuous improvement in supply chain operations.
The Implementation Impacts Business Objectives. But How?
- Salesforce and Tableau dashboards ensure data insights support business goals
- The real-time metrics and KPIs enhance decision-making and increase productivity
- It maximizes return on investment by targeting areas that impact profitability and growth
- Provides a framework for ongoing evaluation and adaptation to meet evolving business needs
- Tableau enhances agility and responsiveness in a dynamic market environment
What’s New in Tableau to Revolutionize Supply Chain Management
- Einstein Copolit for Tableau - This is a newly introduced powerful AI Analytics tool to supercharge and speed up data visualization, and data preparation, and unlock instant accurate insights to make informed decisions. Also, you will get the web authoring feature from August 2024.
- Mult-fact Relationships - Another advanced feature available in the latest Tableau Salesforce 2024.2 version that allows analysts to segregate the datasets and connect with common tables, having shared dimensions like geography and time. It allows them to answer complex analytical questions with ease.
- Viz Extensions - Tableau has introduced this innovative functionality to enhance and broaden data visualization capabilities. It offers users with more tools to present data insights, designs, and layouts.
Apart from these updates, we have also created a descriptive article on the Glossary of Salesforce services and products that should be known and implemented to optimize, automate, and streamline business processes.
Conclusion
Leveraging Salesforce Tableau for retail supply chain optimization offers numerous benefits, significantly enhancing visibility and decision-making. By integrating diverse data sources, retailers can achieve a comprehensive view of their supply chain operations. Tableau’s powerful visualization tools help identify bottlenecks, monitor inventory levels, and forecast demand accurately. This leads to more efficient resource allocation, reduced costs, and improved customer satisfaction.
Moreover, Tableau’s user-friendly interface and interactive dashboards empower stakeholders at all levels to make data-driven decisions. Real-time insights and automated alerts ensure that any issues are promptly addressed, maintaining the smooth functioning of the supply chain. The ability to tailor visualizations to specific business objectives further aligns supply chain strategies with overall company goals.
So now if you are convinced that Tableau is the best visualization and analytics solution for the supply chain and are planning to implement it, consult our expert Salesforce consultants to unlock its full potential, drive continuous improvement, and gain a competitive advantage.
We have also authored a comparison article on Salesforce vs ServiceNow that you must read to try out other viable alternatives than Salesforce.
Come on board with us and experience the digital journey of business transformation with real-time insights as major game changers to become a leader in this data-driven supply chain and retail industry.
FAQs
Tableau is a data visualization and analytics platform that helps businesses make data-driven decisions. It provides tools for creating interactive, shareable dashboards that visualize complex data sets, offering insights into business performance, trends, and opportunities, making it valuable for various industries, including retail and supply chain management.
Salesforce Tableau optimizes retail supply chain management by providing real-time data visualization and analytics. It enables retailers to track inventory levels, monitor supplier performance, forecast demand, and identify bottlenecks. This visibility helps streamline operations, reduce costs, improve inventory accuracy, and enhance decision-making for better supply chain efficiency.
The core challenges in retail supply chain operations include demand forecasting inaccuracies, inventory management issues, supply chain disruptions, supplier reliability, and high operational costs. Additionally, the complexity of coordinating multiple suppliers and logistics partners, maintaining product quality, and adapting to market changes can significantly impact efficiency and profitability.
Tableau helps track key metrics and KPIs such as sales performance, inventory turnover, order fulfillment rates, supplier lead times, demand forecasting accuracy, customer satisfaction, and supply chain costs. These insights enable businesses to optimize operations, improve efficiency, and make data-driven decisions for better overall performance.
Several companies help retail businesses implement Tableau Salesforce into their supply chain process, but TRooTech stands apart from the crowd due to its proficiency and expertise. The Salesforce developers have worked on similar projects and catered to diverse industries, providing the best services at cost-effective rates.
More About Author

Chirag Akbari
As the Salesforce Director of Technology, Chirag leads the design, implementation, and management of customized Salesforce solutions for our clients. With extensive experience in Salesforce architecture and strategic planning, Chirag ensures that all projects are aligned with clients' business objectives and delivered on time and within budget. He oversee a talented team of Salesforce professionals, fostering innovation and adherence to best practices. Chirag is dedicated to providing exceptional client service, from initial consultation through to training and support, ensuring that clients maximize the value from their Salesforce investments.